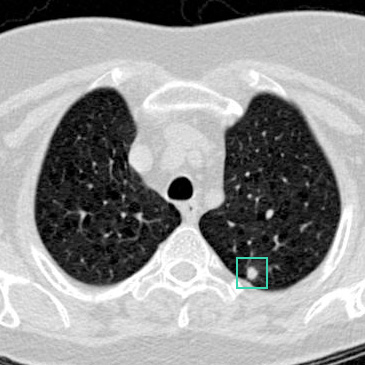
The CT you already have
The lung nodule is identified on the existing scan, by the radiologist or by a detection system.

Radiomics is the measurement of patterns inside a medical image that are present in the data but too complex for the human eye to distinguish. RevealAI-Lung measures those patterns on a single lung nodule.
The lung nodule is identified on the existing scan, by the radiologist or by a detection system.

Radiologists see size, morphology, opacity, and other features. But higher-order patterns are hidden within and between the voxels that are too complex for our eyes to classify.

The same voxels, with their differences made visible. Texture, intensity and internal structure emerge from data that was always in the image.
Properties of the tissue are measured and normalized, so a scan from one scanner can be compared fairly with a scan from another.
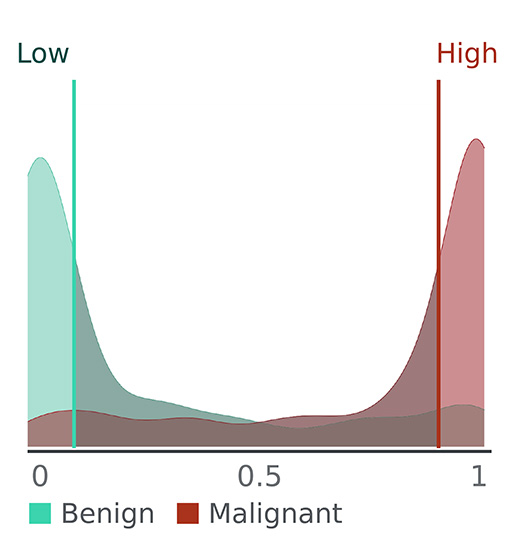
The profile is placed against a reference database of lung nodules whose diagnoses were confirmed over years of follow-up.
The Malignancy Similarity Index, shown alongside the reference distribution of confirmed cases the nodule was compared against.
Panels 1 and 2 are clinical data from the NLST training dataset. Panel 3 is an illustrative representation of the same nodule in Panel 2. Panel 4 is illustrative and not actual device output. Panel 5 is the smoothed distribution of mSI values for the reference NLST dataset. The mSI value in Panel 6 represents actual device calculation.
Every CT is a grid of measurements. Each voxel records how much the tissue at that point absorbed the X-ray beam. A radiologist sees those voxels and discerns size, morphology, and other features within the nodule like opacity and solidity. But within and between those voxels are more complex patterns that we can't discern by eye.
Radiomics measures those differences directly: it extracts quantitative patterns within the data that are too complex for our eyes to process. Those measurements form a digital biomarker — a relationship between those patterns and nodule malignancy.
Radiologists are right to ask what an AI tool is actually responding to. For RevealAI-Lung it is the radiomic features of the lung nodule itself, measured from the CT data at the point of nodule.
The score reflects the radiomic features of that nodule, whether it was selected by the radiologist or flagged by a detection system. Where several nodules are present, each one can be assessed on its own.
Intensity, texture and structure within the nodule, normalized by a documented process so results stay consistent across scanners, kernels and acquisition settings.
The nodule’s features are converted into a standardized profile and compared against a reference set of lung nodules whose diagnoses were confirmed over at least five years of follow-up. The mSI™ reports how closely that profile resembles the confirmed malignant cases.
The reading radiologist reviews the mSI™ against the images and interprets it alongside size, growth and clinical history.
The approach RevealAI-Lung uses to characterize lung nodules is protected by U.S. Patent No. 10,255,997.
The nodule is identified, the score returns in seconds, and the finding goes into the report the radiologist was already writing.
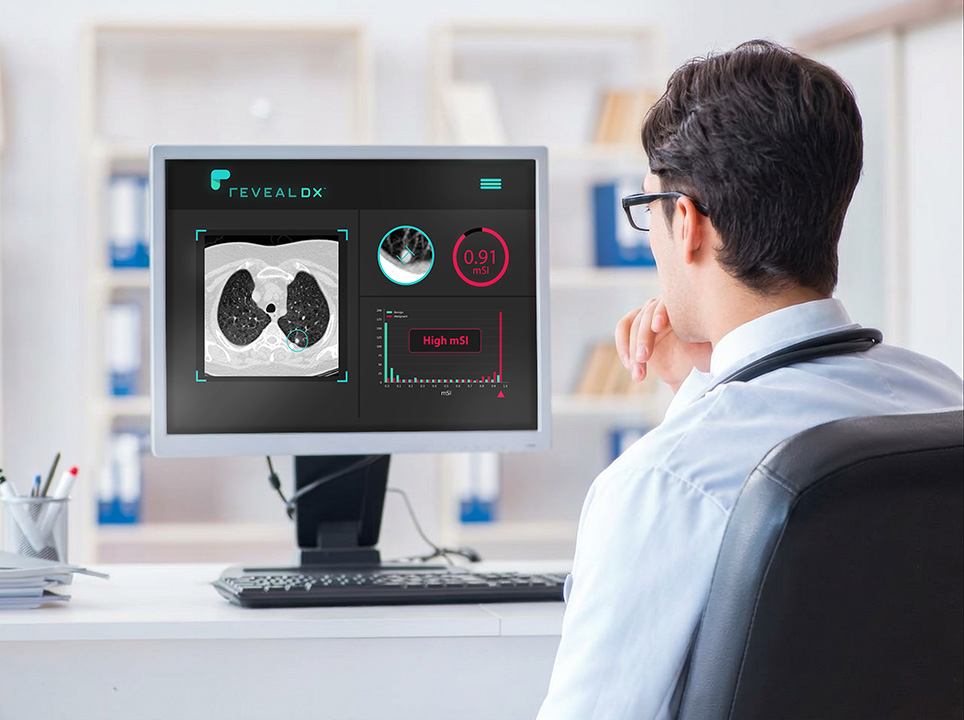
By your detection tool, or by your own click on the nodule center. The analysis runs on the scan you already have.
Radiomic features are extracted and scored in seconds, and returned in a frame inside your existing viewer, with a histogram of confirmed cases at that score.
The score sits alongside size, growth and clinical history, supporting the follow-up recommendation you sign.
mSI™ is continuous from 0 to 1. RevealDx validation studies have grouped it into three bands — low, intermediate and high — as an aid to interpretation, though the underlying value is continuous and carries information across the whole range. It expresses how closely a nodule's radiomic features resemble those of confirmed malignant nodules in the reference database. It is not a percentage probability of cancer, and it does not replace guideline-based follow-up.
| mSI™ | Interpretation | What it supports |
|---|---|---|
| Below 0.1 | Features closely resembling confirmed benign lung nodules | Consider downgrading the surveillance interval, or continued care as currently planned |
| 0.1 – 0.9 | Intermediate — partial resemblance, rising with the score | Weigh the value alongside size, growth and the clinical picture. A lower action threshold finds more cancers and accepts more false positives. |
| Above 0.9 | Features closely resembling confirmed malignant lung nodules | Consider accelerated follow-up or expedited workup |
These are what the score supports, not what it instructs. The mSI™ is interpreted alongside nodule size, growth and clinical history. The management decision, and the conversation with the patient, remain yours.
Why small lung nodules are different →